

One of the best parts of my job is getting to meet with non-profit leaders who are doing phenomenal work to improve their communities. In most cases, the programs and services they have in place are perfect examples of what funders are looking to support. But when I start asking questions about expected and achieved outcomes, I often get some exasperated looks.
I get it. There are so many reasons why evaluating your programs and services is on the bottom of the to-do list. Do any of these sound familiar?
You’re too busy because you’re already serving as the Executive Director, Chief Finance Officer, Administrative Assistant, Program Director, Marketing Coordinator, and Development Officer.
It’s frustrating to have to prove your outcomes to others when you can see the difference you make every single day.
Every resource on evaluation is at least 100 single-spaced pages full of technical jargon.
Regardless of the reason you’ve been putting off evaluation, it’s time to suck it up, buttercup. The days of getting funded for programs or services that have no proven benefits are long gone. Even if you don’t need funding (really, who are you?!), truly knowing what difference you make can have a huge impact on the work you do. Evaluation can help you:
Identify opportunities for improving your programs and services
Increase staff and volunteer morale (there’s nothing like knowing how much of a difference you made today)
Enhance accountability and relevance to your current supporters
Prove to your community and potential funding partners that you’re a worthwhile investment
With all that said, I know that planning and implementing a full-scale evaluation on every existing program and service is unrealistic for many organizations. So, here’s a step-by-step process (with minimal evaluation jargon, I promise) for integrating some basic evaluation activities into your organization.
STEP 1: CLARIFY YOUR EXPECTATIONS
How many times have you implemented a program or service without considering exactly what you expected to accomplish? Probably at least a few. This happens all the time because we see a community need and want to address it as quickly as possible.
If you’re currently operating programs or services that don’t have clearly outlined goals and objectives, it’s time to clarify your expectations. The most common way of doing this is to complete a logic model for each program and service. But since I promised minimal evaluation jargon, we’re going to simplify this a bit.
First, write down all the programs and services you offer. For each one, you’ll want to list all your expected outputs and outcomes (bonus points for including your expected impact!). Here’s a review of what these evaluation terms mean:
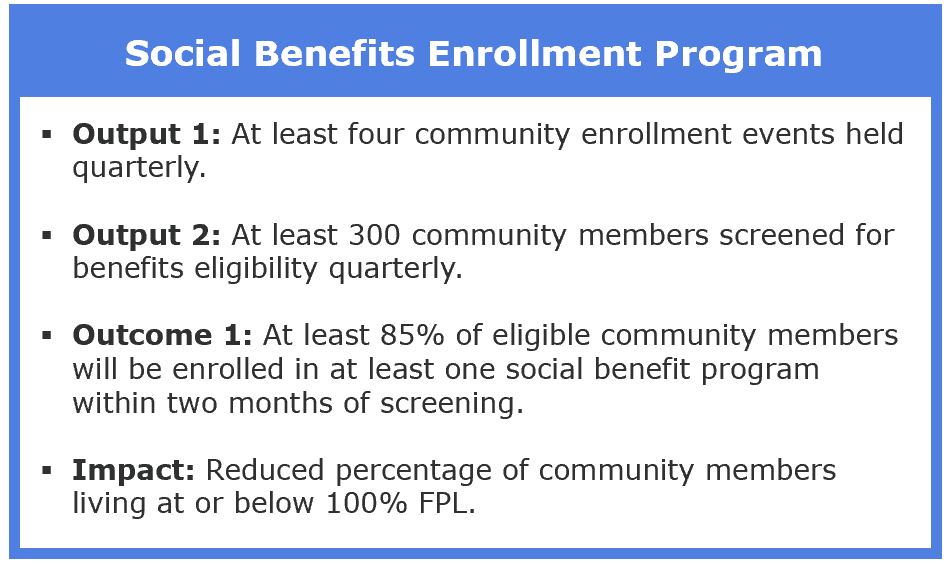
Outputs: These are the direct results of your program or service activities. Outputs are measures of how effective you were at implementing the program or service as planned. Examples of outputs include: the number of health education sessions offered, the number of brochures distributed, or the number of meals served.
Outcomes: Outcomes tell you what difference you’ve made for the individuals who were exposed to your programs or services. Outcomes often measure a change in behavior, knowledge, skills, or conditions. Examples of outcomes include: the percentage of participants who were able to secure full-time employment, the percentage of students who improved their knowledge or skills, or the percentage of participants who increased their fruit & vegetable intake.
Impact: Impact is the long-term change you expect to see in your community because of a program or service. Impacts are indirect results of your efforts and are often very difficult to tie directly to your programs and services. Examples of impacts include: reduction in the percentage of children living in poverty, reduction in the teen pregnancy rate, or county-wide high school graduation rates.
Here’s an example of some measurements you might select for a hypothetical social benefits enrollment program.
STEP 2: DETERMINE YOUR DATA NEEDS & SOURCES
Now that you’ve established your outputs, outcomes, and impact it’s time to determine the data you’ll need to measure your progress. Go back to each output, outcome, and impact and list all the data you’ll need to determine if you’ve achieved each one.
You’ll also need to identify the source for all your data.
Here is what that would look like from the previous example:
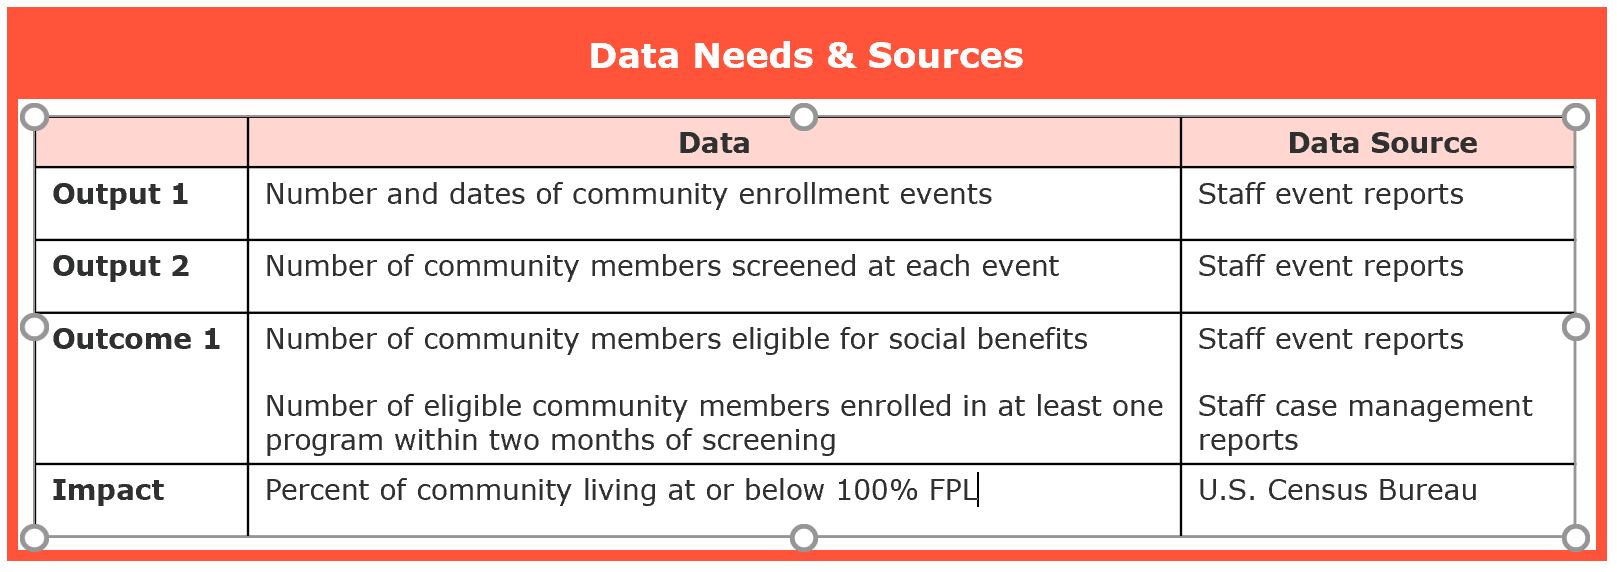
Notice that there are two pieces of data and two sources required for Outcome 1. That’s because the outcome measurement is the percentage of screened community members enrolled, which will require the staff to collect data for both the numerator (number enrolled) and denominator (number eligible). Be careful to always consider all the data you’ll need to complete your analysis.
STEP 3: DEVELOP DATA COLLECTION TOOLS
If you don’t have existing data collection tools that will provide the data you identified in step 2, you’ll need to create some new tools. There are all kinds of tools that can help you collect data, but what you develop will ultimately depend on the information you need.
Here are a few examples of common data collection tools:
– Client intake forms that capture basic demographics
– Surveys
– Focus groups or key informant interviews
– Staff reports
– Checklists
– Pre- and/or post-assessments of an event or activity
– Spreadsheets
In the social benefits program example above, I listed staff event reports and case management reports as the two organizational documents needed to collect program data. If this organization didn’t already have those tools in place, they could easily create two basic documents that captured all the event- or client-specific data needed. They could even add additional data fields that could be used to support the evaluation of other programs or services.
STEP 4: DEVELOP DATA COLLECTION AND MAINTENANCE PROCESSES
Okay, at this point you know what you hope to accomplish, the data you’ll need to determine if you’re meeting your goals and objectives, and how you’re going to collect the data.
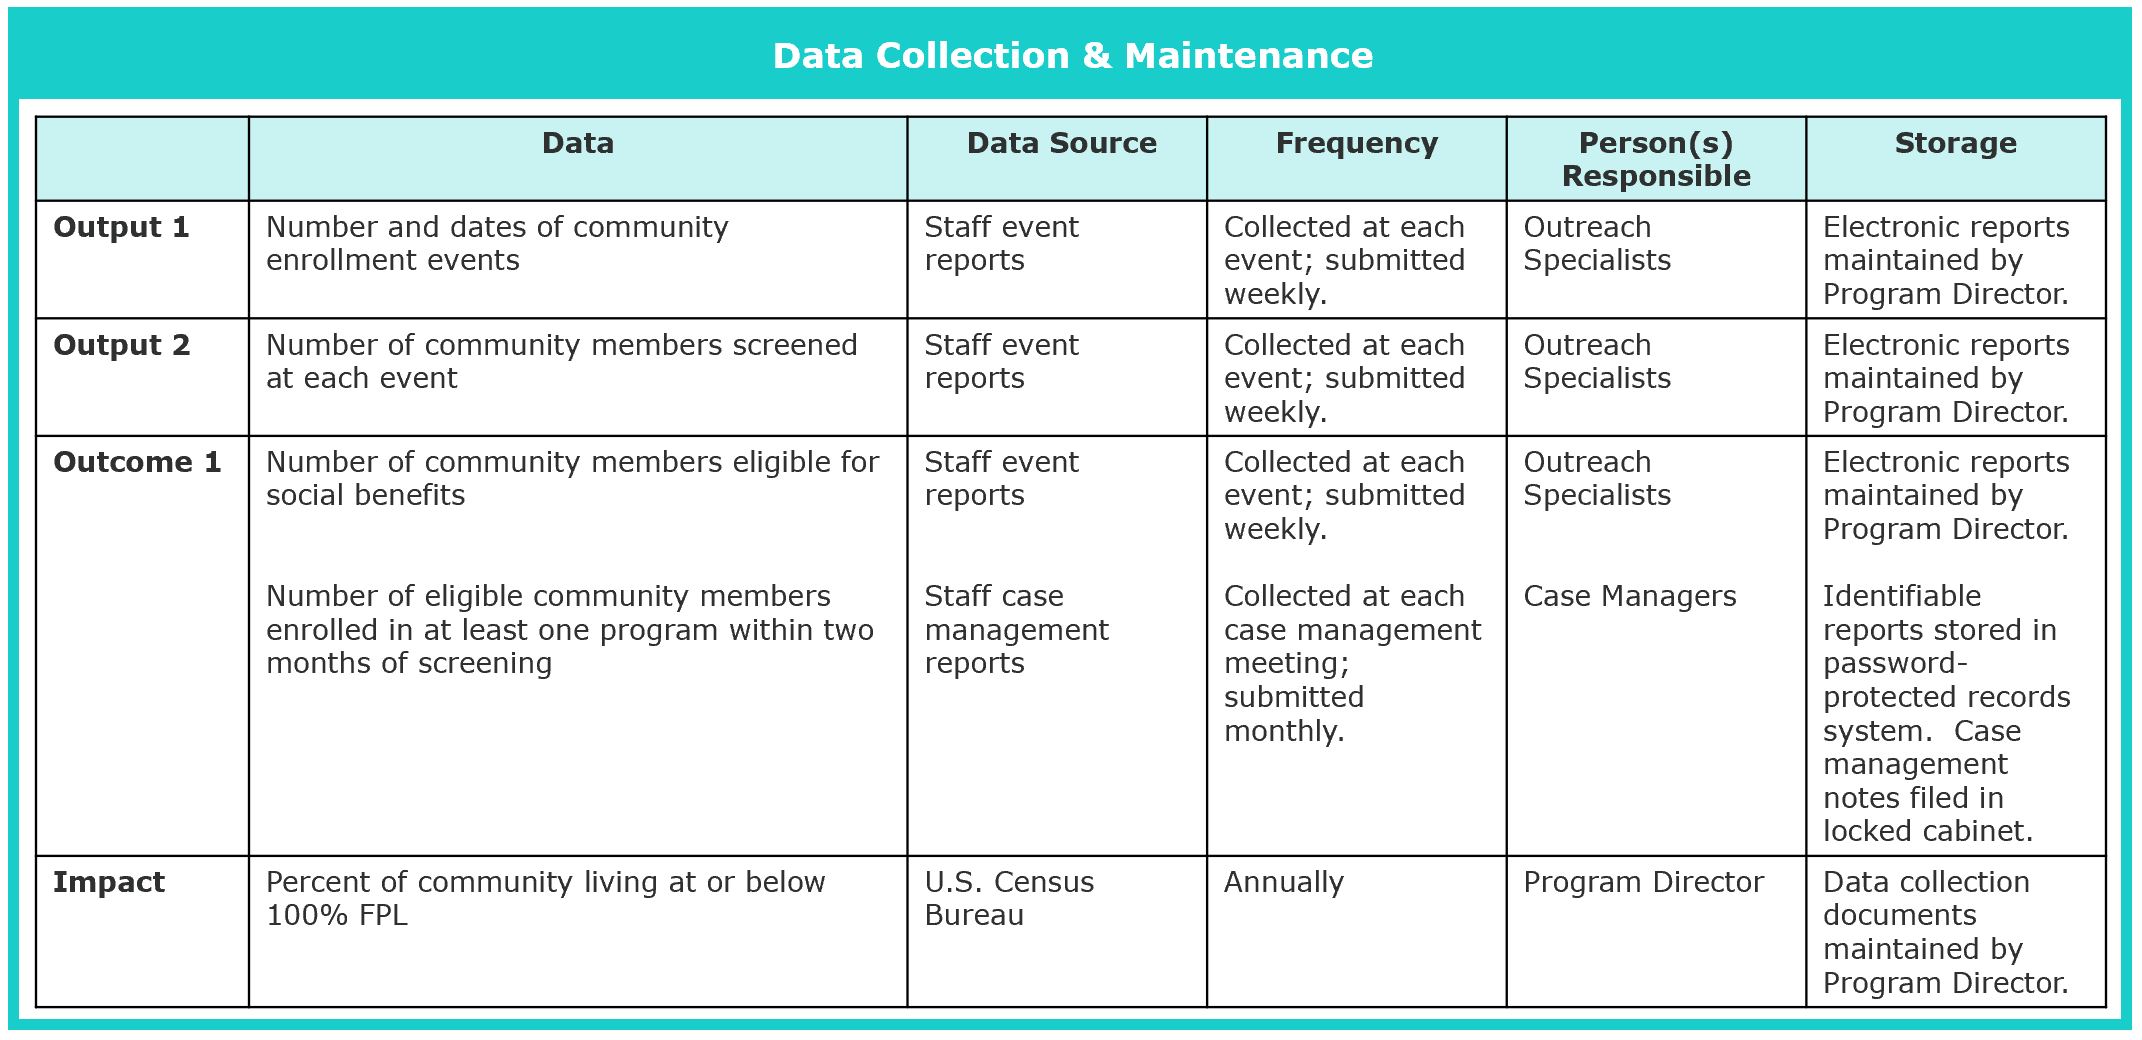
Now it’s time to develop processes for collecting, maintaining, and analyzing all this information. The easiest way to begin visualizing this is to simply add on to your existing chart of data and data sources. You can see below that I’ve expanded on what we had to indicate how frequently data would be collected, who is responsible for data submission, and where the information will be stored.
You’ll also want to establish some clear guidelines for all staff who will be responsible for data collection and maintenance. Here are some basic questions you should address to ensure everyone is prepared:
– What data will be collected and when?
– Who is responsible for collecting each piece of data?
– What tools should be used to collect the data?
– How and when should data be submitted?
– What safeguards will staff follow to ensure identifiable information is protected?
This step may be the MOST important step. If you and your staff aren’t fully prepared to implement data collection and maintenance activities, you will lose valuable data. In many cases, when you lose data, you won’t be able to use any of the data you’ve collected.
STEP 5: PLAN FOR DATA ANALYSIS AND REPORTING
Now for the really fun part…analysis and reporting! You never want great data to go unused so it’s helpful to plan for when and how you’ll analyze and report your data. I know “analysis” sounds intimidating but if you can calculate percentages and fractions, then you are performing a simple descriptive analysis. And remember, this is about implementing some basic evaluation activities, not conducting a full-scale evaluation.
So, let’s go back to our original measurements and consider what type of analysis and reporting would be the most appropriate.
Output 1 & 2. The “analysis” here involves a simple count of the number of enrollment events held and the number of individuals screened for eligibility. You could also divide your actual numbers by the expected numbers to determine your success rate (e.g., you held two events, but your goal was four, so you achieved 50% of your expected output).
This information could be reported during regular staff or board meetings or compiled and included in an annual report. You can also share this information on your website or in social media posts (e.g., “In 2018, we exceeded our goal for community enrollments! We held 25 events and successfully enrolled 500 eligible individuals in life-saving social benefits programs.”).
Outcome 1. This measurement is also super easy. Simply divide the number of individuals enrolled within two months of screening by the total number of individuals who were eligible to determine your percentage. For example, if you found 200 eligible individuals and 150 of them were enrolled within two months of screening, then you’ve achieved a 75% enrollment rate (150/200 * 100).
This information would also be helpful to include in staff or board meetings, which might generate some great conversation about how you can better support individuals in completing their enrollment process. You can also report this information in annual reports and on your website or social media pages.
Once you’ve determined the types of analysis and reporting you’ll be doing, add those details to your chart.

That’s it! Not so bad, right? Now you have the tools you’ll need to add some basic evaluation activities into your organization. Let me know how you feel once you get started. I think you’ll find it’s empowering to realize exactly how much of a difference you’re making in your community.
Do you have other tips for adding basic evaluation activities to your organization? Comment below and let us know!
- How to streamline your grant process - November 2, 2021
- Should your nonprofit add a new program or service? - April 27, 2021
- How to tell if a federal grant is a good fit - April 13, 2021